Financial Performance Scorecard & Predictive Growth Model for a Manufacturing Facility
Improving growth quality, margin visibility, and forward-looking decision-making
Client Context
A mid-sized manufacturing facility operating across multiple product lines and customer segments was experiencing steady top-line growth. However, senior management lacked clear visibility into whether this growth was translating into sustainable profitability.
Financial reporting focused primarily on aggregated revenue trends, while margin analysis was fragmented across spreadsheets and ad-hoc analyses. As the business expanded into new items and customers, leadership needed a single, coherent performance framework to understand growth quality, risk concentration, and future demand patterns.
Key Challenges
Revenue Growth Without Profitability Clarity
Year-over-year (YoY) revenue increases were visible, but it was unclear:
Whether growth was driven by high-margin or low-margin items
If expanding customers were diluting overall gross profit
How pricing, mix, and cost changes interacted
The organization could not easily identify:
Growth concentrated in structurally low-margin or volatile segments
Customers or items with declining profitability masked by volume growth
This increased the risk of scaling unprofitable business.
Fragmented Margin Analysis
Gross profit analysis existed in silos:
Item-level margins were reviewed separately from customer performance
No consistent linkage between revenue growth, cost behavior, and margin erosion
No Forward-Looking View
Planning relied heavily on historical trends, with limited ability to:
Forecast item-level growth
Anticipate shifts in demand and margin contribution
Support proactive production and commercial decisions
Solution Design
A Financial Performance Scorecard was developed, combining historical performance analysis with predictive modeling to support both retrospective insight and forward-looking decisions.
The solution was designed as a decision-support tool, not just a reporting dashboard.
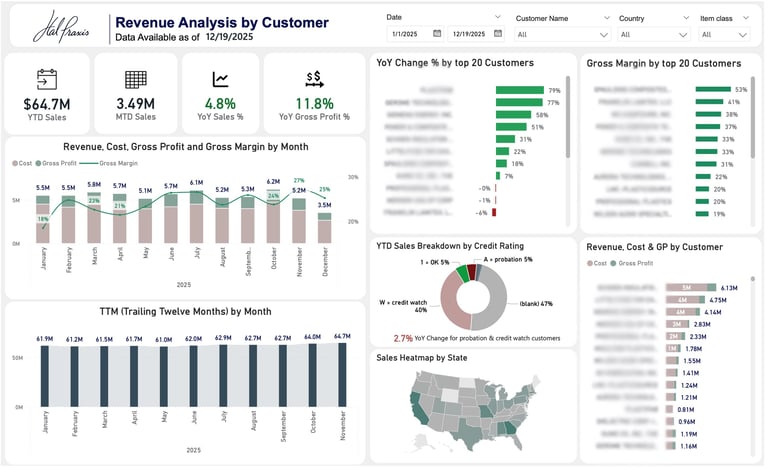
YoY Revenue vs. Gross Profit Analysis
The scorecard explicitly decomposed performance into:
Year-over-year revenue growth
Corresponding changes in gross profit and gross margin
This allowed leadership to immediately assess whether growth was value-accretive or margin-dilutive.
Growth Quality & Risk Flagging
Built-in logic highlighted:
Growth driven by low-margin or declining-margin items
Customer segments where volume expansion increased risk exposure
Discrepancies between revenue momentum and profitability trends
This shifted the discussion from “how much did we grow?” to “how healthy is our growth?”
Item- and Customer-Level Profitability Views
The model delivered granular visibility into:
Gross profit by item–customer combination
Margin dispersion across customers for the same product
Dependency on a small number of items or customers for profit contribution
These views supported pricing reviews, customer negotiations, and portfolio rationalization.
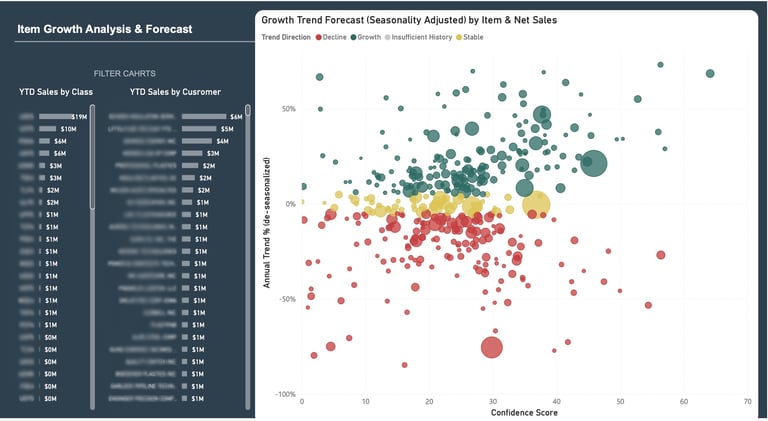
Predictive Item Growth Model
A lightweight forecasting layer was implemented to:
Predict item-level growth trajectories based on historical patterns
Identify early signals of accelerating or declining demand
Support production planning and commercial prioritization
The forecast outputs were integrated directly into the scorecard for seamless interpretation.
Key Deliverables
Financial Performance Scorecard with YoY revenue and gross profit analysis
Growth Risk Indicators highlighting margin dilution and segment exposure
Item & Customer Profitability Views for granular margin management
Item-Level Forecasting Model to support forward-looking decisions
Executive-Ready Dashboards enabling rapid interpretation and action
Business Impact
Improved Growth Quality Assessment
Leadership gained a clear, consistent view of whether revenue growth was strengthening or weakening gross profitability.
Early Risk Identification
The scorecard surfaced high-risk growth patterns early, enabling corrective actions before margin erosion became structural.
Better Commercial Decisions
Item- and customer-level profitability insights supported:
More informed pricing discussions
Targeted customer focus
Rationalization of low-value product lines
Forward-Looking Planning Capability

Deliverable Excerpts (Not Exhaustive)
© Hal Praxis 2025. All rights reserved.
Register Code: 304291595
Anapilio 30 Vilnius, Lithuania